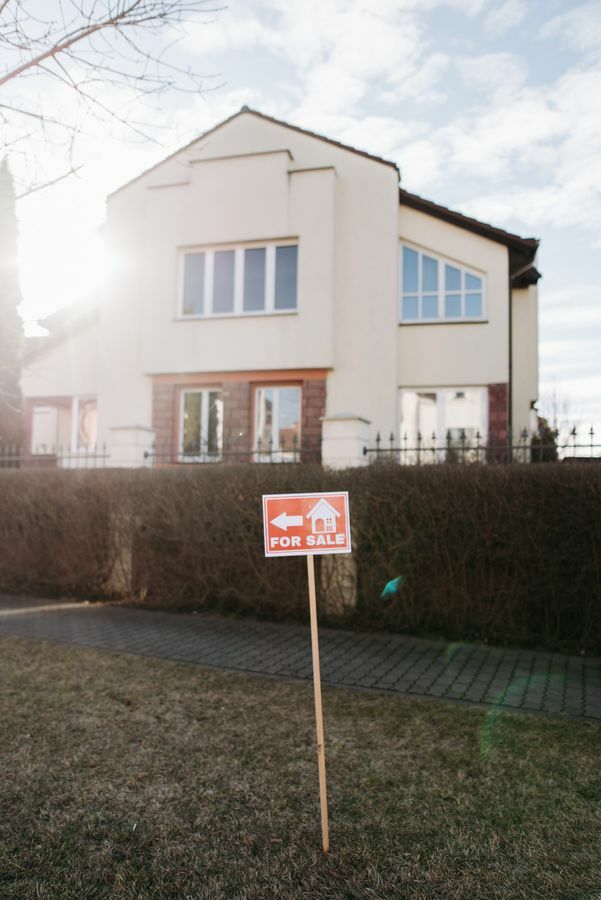

If you are getting ready to list a home this winter, or you already have one sitting on the market, new data from Realtor.com gives you a clearer read on what you are actually competing against. The headlines about housing have swung between "crash" and "cooling" for months, but the October 2026 numbers, published November 4, 2026, tell a more specific story. Sellers are not panicking. They are freezing. And those are two very different situations to price into.
What the Numbers Actually Show
Active listings nationwide grew to 1,183,520 homes in October, up 7.4 percent from a year earlier, according to Realtor.com's October 2026 housing report. That is the fourth straight month of accelerating inventory growth and the fastest annual increase in eight months. At the same time, new listings fell 7.5 percent year over year to 357,268, the steepest drop since September 2023. Put plainly, fewer sellers are stepping onto the field, but the ones already on it are staying there longer, so the total pile of homes for sale keeps growing even as fresh supply slows down.
That combination matters more than either number alone. A market that is simply "more homes for sale" sounds buyer-friendly. A market where sellers are not refreshing their listings, not aggressively cutting prices, and not walking away either, is something closer to a standoff. Realtor.com's own economists framed it as sellers being "off market or on" and disengaging rather than reacting. The delisting rate, the share of active listings pulled off the market, was 4.4 percent in October, barely changed from 4.6 percent a year ago. If sellers were truly panicking, you would expect that number climbing. It is not.
Price cuts tell a similar story. About 20.5 percent of October listings had a price reduction, which sounds high until you compare it to last year's 20.3 percent, a gap of just two tenths of a point. September's figure was actually a bit higher at 20.8 percent, so the price cut share eased slightly going into fall instead of accelerating. The more revealing figure is this one: only about 43 percent of today's active listings have ever had a price reduction at any point this year, down sharply from close to 55 percent a year ago. Fewer sellers are needing to cut at all, even with homes taking longer to sell.
And homes are taking longer. The median time on market in October was 63 days, two days longer than September and one day longer than a year ago. That ends a run of four straight months where homes were moving at or faster than the year-ago pace. It is not a dramatic slowdown, but it is the clearest sign yet that the easy, fast-moving spring and summer market has given way to something more patient on both sides.
What This Means for Your Listing Strategy
If you are weighing whether to list now or wait, the data above tells you two things worth sitting with. First, you are not walking into a market where buyers have all the leverage and sellers are desperate, so you do not need to assume you must slash your price just to generate interest. The seller behavior in this data is closer to patient than fearful. Second, you are also not walking into a tight market where any listing gets snapped up quickly. With active inventory up 7.4 percent and sitting an average of 63 days, your home is one of a growing pool, and buyers who are still shopping in this rate environment have more time and more options than they did a year ago.
That combination argues for getting your pricing right on day one rather than testing a high number and planning to adjust later. Nationally, 43 percent of listings have needed at least one price cut this year. The homes avoiding that fate are generally the ones priced to the current market from the start, not the ones priced to where the market was six months ago. A listing that sits past the 63 day median starts to carry its own stigma with buyers who track days on market closely, so the cost of overpricing is not just a slower sale, it can also mean a harder sale once you do cut.
It is also worth knowing that this data is not uniform everywhere. Regionally, the South and West have seen inventory climb back above pre pandemic norms, while the Northeast and Midwest remain well undersupplied even after months of catching up. If you are in a metro where listings have grown quickly, you are facing more direct competition from similar homes than a seller in a tighter market would. Ask your agent for local days on market and price cut figures specific to your zip code or neighborhood rather than leaning only on the national numbers above, since the spread between the fastest and slowest moving metros in this report is wide.
None of this means you should assume prices are about to move sharply in either direction from here. The data above describes what already happened in October, not what happens next, and this piece is not making a call on where rates or prices head this winter. What it does tell you is that the sellers currently getting through this market without repeated price cuts are the ones treating their first list price as their real price, backed by current local comparables, not last spring's expectations. If you are listing this winter, that discipline matters more than timing the calendar perfectly.
If you already have a home on the market and have not had to cut your price, the data above suggests you are in reasonably good company nationally, though your own local days on market figure is the number to watch most closely. If you are still finalizing your list price, treat the current pool of competing inventory as real competition, not background noise, and price against what is actually sitting unsold in your area right now rather than what sold earlier in the year.